Data analysis Part 2
Finalising data collection
After I had received 125 responses I decided to stop the data collection this would be more than enough to run statistical analysis. I first had to rerun the Cronbach’s Alpha reliability tests to see whether the elements that I had identified was still significant and if there had been any changes in the level of significance. I decided not to run the test for the elements that gave a reliability score of less than 0.500 as this factor would not be contributing to atmosphere.
The results are as follows (first I identify the objective element next is a list of the photographs that exhibit their element and finally its reliability score):
Subject Person 2,5,15,16,17
0.694
Particles 5,8,11,12,13,14,15
0.746
High contrast 1,2,5,7,8,12,13,14,15,18
0.798
Low key images 5,12,13,14,15,18
0.730
depicts outside 1,2,5,6,7,8,9,11,13,17
0.744
Elements obscured 1,12,13,15,18
0.644
Burnt out highlights 1,2,4,7,13,15,18
0.736
Specular highlights 2,4,12,13,14
0.635
Light source is visible in the image 2,4,8,13,18
0.678
Everything in the frame is in focus 4,6,7,8,10,11,15
0.712
Images taken inside 2,4,12,14,15,18
0.729
Images contain the colour gold 2,3,4,8
0.698
Edges darker than centre* 2,4,12,13,14,15,18
0.727
Directional light causing deep shadows* 1,2,5,8,13,15,18
0.738
*calculated later see later in text
Again, I am looking for scores exceeding .7 or close to it for me to consider them statistically reliable. With the reliable elements I then created as a compound variable. This is where I used SPSS I compute the average of the scores for those elements in that photograph. In the end I created 10 compound variables. With these compound variables I can then run a PCA test which then allows me to discover which of those compound variables is contributing to the atmosphere of the image.
My initial results

In this table we can see that 82.6% of for variance (attributes of the image that contribute to the image’s atmospherics) can be explained by component 1 (a component is a set of variables, in this case my calculated compound variables, that explained variance)(Cigliana 2021). In the second table we can see all my compound variables and how they make up the component. Identify the lowest scoring images within the component and these were eliminated in the next calculation and then the process was repeated several times watching how the removal of compound variables affected variance.
Refining results
As you can see from the table below I have added an additional compound variable. This was as a result of the feedback from the PCA test and I was attempting to see if there were any other variables that with better explain the results that I was getting from the compound variables. I then though of ‘edge is darker than the centre’ and ‘directional light causing deep shadows’. in the end however darker edges was a better fit I was now able to explain 94.421% of the variants with four component factors.
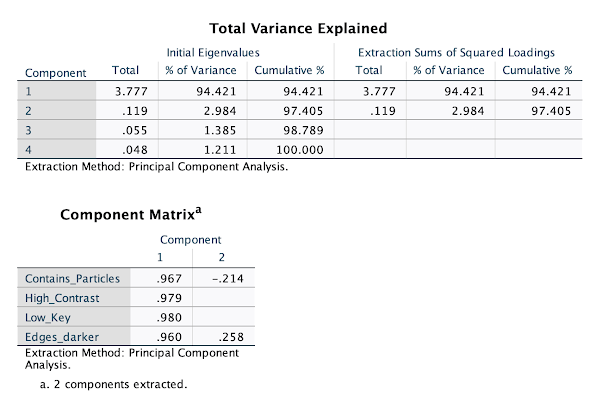
I can now determine of the characteristics I have identified (there may be others that I have not though of, indeed they are an infinite number of objective measures of these images), the ones that are most impactful on whether an image is considered atmospheric are as follows:
• The image contains particles
• The image is high contrast
• The image is low key
• The image has darker edges that the centre creating a perception of being enclosed
Ergo if an image has these elements in it then generally the image will be rated as more atmospheric.
Statistical data not discussed
Number of components: Normally, I would identify more than one component where each component would contain different set of variables. The idea would be to identify relationships among the data that don't come at face value. My data however, is different in that I have already deduced variables based on characteristics that were not made apparent to my respondents, but that are represented in theory (initial research into atmosphere). So it makes sense that the variable characteristics you have chosen are related. The SPSS looks at components and the variances it will generate as many components as necessary to explain 100% of the variance. Hence why there is a section that give the percentage and cumulative percentage.
Comments
Post a Comment